Reflection: After reflecting on these 5 mini-projects, it’s clear that each one ties into the larger themes of the course and builds off of the concepts we’ve learned. Mini Project 1 was an awesome introduction to how simulations can be used to understand the behavior of different distributions, simply put. By interpreting and plotting the simulated maximum and minimum values of the 4 distributions, we saw how the by-hand calculated standard errors lined up with these values for symmetrical distributions but didn’t really when it came to skewed data. This project was a foundational one, helping to ground our understanding of how variability within data shows itself in application and visualization.
Mini Project 2 provided a refreshing shift in focus from analytically to comprehensively understanding the terms we had been using throughout the semester (and in probability). It wasn’t just about the math or formulas, but rather about how the statistical concepts we’ve studied play out in a more tangible way. By applying terminology we’ve used all semester to something personal and relatable, like in my case an actual non-fiction story about my townhouse, the project solidified the meanings behind these terms in my head beyond just using numbers and labeling them by following what it said in a prompt. It also highlighted how crucial it is to understand both the calculation and the context when dealing with statistics.
In Mini Project 3, we dove deeper into confidence intervals, interval widths, coverage rates and sample sizes. It was important to see how larger sample sizes help bring coverage rates closer to the confidence level. This reinforced the idea we have been taught pretty much throughout my entire time studying statistics; that bigger sample sizes generally lead to more reliable estimates. This ties back to what we saw in Project 1 about the reliability of distributions. The narrowing of the confidence intervals with large n’s also emphasized why working with large datasets is so critical for a more accurate, well-rounded statistical analysis.
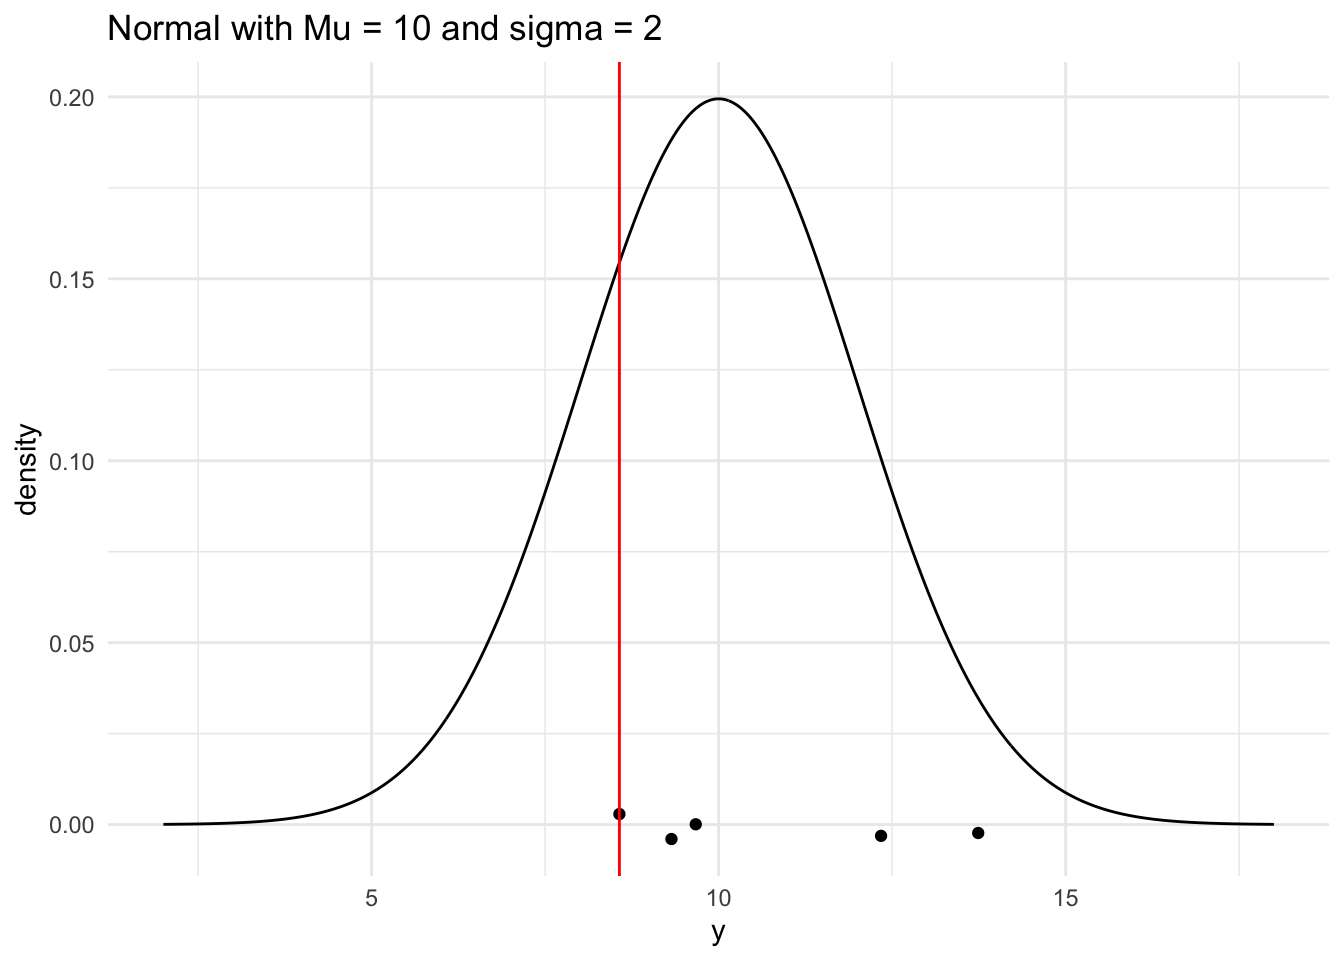
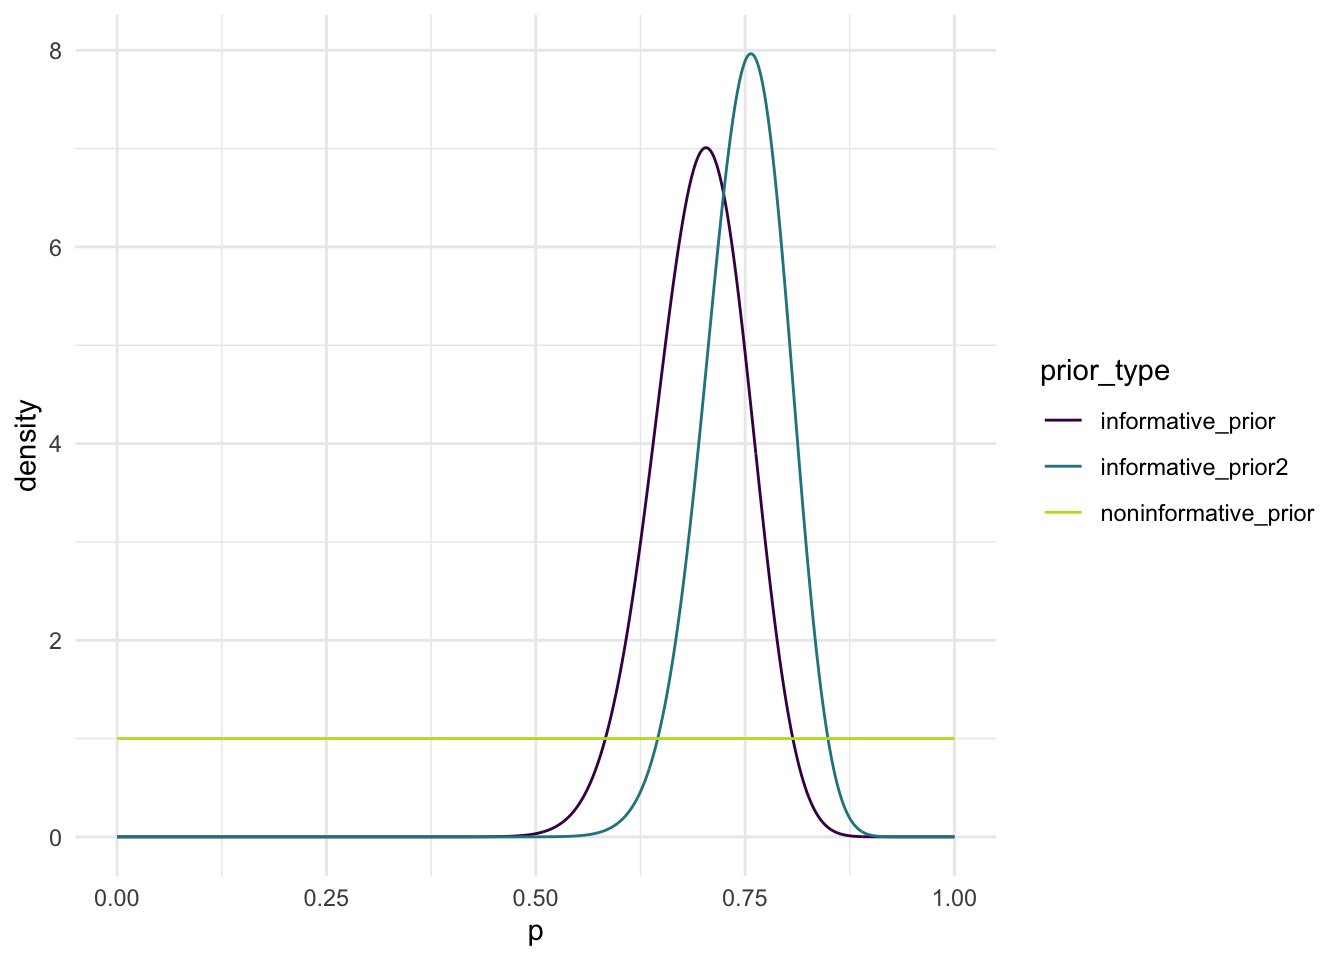
Mini Project 4 brought in more of a “statistical thinking” element. This project wasn’t as clear-cut as some of the others; it relied on applying prior knowledge (or not) to inform posterior distributions and make subjective decisions about what the data was telling us and which distribution was the best fit. Unlike in previous projects wehre there were more definite outcomes, here the statistical reasoning came from using available information to make the best possible guess. The uncertainty built into this project helped push me to think more critically, which also tied nicely into project 5.
Finally, Mini Project 5 was a perfect conclusion to everything we have learned so far, as there are a good amount of stat majors in the class who will come across p-values sometime in the near future. The idea of looking beyond p-values and considering statistical thinking from a broader perspective was essential. It was a stark reminder that relying on a single statistical threshold doesn’t always tell the full story, and that understanding the context and depth of the data can lead to more meaningful conclusions. This project brought together everything from the course: probability, statistical thinking, and practical application, all while challenging us to move beyond the rigidity of p-value significance.
Taken together, these Mini Projects encapsulate the blend of technical skills and critical thinking that are essential for navigating real-world data and analysis. They all tied together concepts we’ve explored while pushing us to think beyond numbers and formulas, and I think that’s the biggest overall takeaway. Statistical analysis isn’t just about calculating values, it’s about interpreting them in context and being aware of the nuances that lie beneath the surface, or the p-value.